SAR Imagery Shows Extent of Caracas Earthquake Land Displacement
On 24 June 2026, a pair of earthquakes struck near Caracas, Venezuela, They caused significant ground movement and damage. The extent of the movement of the ground can be determined using satellite imagery. By using before-and-after images of the area around Caracas, the extent of the land movement can be measured.
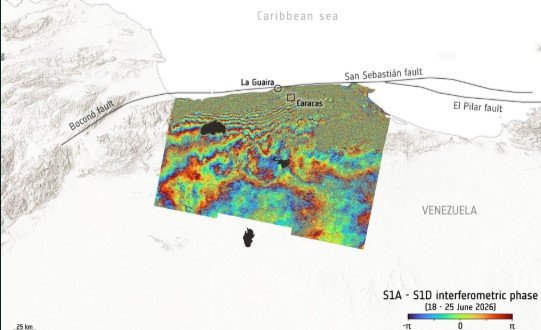
Analysists are using data from Copernicus Sentinel-1, which carries radar instruments capable of detecting tiny shifts in ground level. The visualization is an interferogram, produced by comparing radar data from two dates: 18th June, before the quakes, and 25th June, the day after. The northern part of the image displays the area where ground movement occurred, visible as a fringed pattern. Preliminary measurements suggest a displacement of about 30 centimeters along the line of sight from the satellite.
Two earthquakes occurred within less than a minute of each other, with magnitudes 7.2 and 7.5, as recorded by the United States Geological Survey (USGS). USGS notes that the 7.2-magnitude event happened first, followed by the 7.5-magnitude mainshock after 39 seconds. Both events happened at relatively shallow depths, which contributed to strong shaking, widespread damage, and fatalities.
The shaking affected the northern coast, an area on the San Sebastian fault system. This fault runs roughly 500 kilometers along Venezuela’s coast and into the Caribbean Sea. The 7.5-magnitude quake represents the strongest event to hit Venezuela since 1900. The mapped area extends from Caracas toward Puerto Cabello, about 210 kilometers to the west. La Guaira, located about 20 kilometers north of Caracas, was among the most severely affected places.
The Copernicus Sentinel-1 mission uses a C-band (4-8 GHz) Synthetic Aperture Radar (SAR) system. SAR measures changes in Earth’s surface with high precision by processing data in a way called interferometry (InSAR). Interferograms are produced when the satellite emits radar signals and later records their return after bouncing off the terrain. By comparing multiple readings from the same location taken at different times, scientists calculate how the surface has shifted.
On 24 June 2026, a pair of earthquakes struck near Caracas, Venezuela, They caused significant ground movement and damage. The extent of the movement of the ground can be determined using satellite imagery. By using before-and-after images of the area around Caracas, the extent of the land movement can be measured.
Analysists are using data from Copernicus Sentinel-1, which carries radar instruments capable of detecting tiny shifts in ground level. The visualization is an interferogram, produced by comparing radar data from two dates: 18th June, before the quakes, and 25th June, the day after. The northern part of the image displays the area where ground movement occurred, visible as a fringed pattern. Preliminary measurements suggest a displacement of about 30 centimeters along the line of sight from the satellite.
Two earthquakes occurred within less than a minute of each other, with magnitudes 7.2 and 7.5, as recorded by the United States Geological Survey (USGS). USGS notes that the 7.2-magnitude event happened first, followed by the 7.5-magnitude mainshock after 39 seconds. Both events happened at relatively shallow depths, which contributed to strong shaking, widespread damage, and fatalities.
The shaking affected the northern coast, an area on the San Sebastian fault system. This fault runs roughly 500 kilometers along Venezuela’s coast and into the Caribbean Sea. The 7.5-magnitude quake represents the strongest event to hit Venezuela since 1900. The mapped area extends from Caracas toward Puerto Cabello, about 210 kilometers to the west. La Guaira, located about 20 kilometers north of Caracas, was among the most severely affected places.
The Copernicus Sentinel-1 mission uses a C-band (4-8 GHz) Synthetic Aperture Radar (SAR) system. SAR measures changes in Earth’s surface with high precision by processing data in a way called interferometry (InSAR). Interferograms are produced when the satellite emits radar signals and later records their return after bouncing off the terrain. By comparing multiple readings from the same location taken at different times, scientists calculate how the surface has shifted.