NASA Detects a Massive Pacific Anomaly With Signs Pointing to a Major El Niño Growing Beneath the Waves
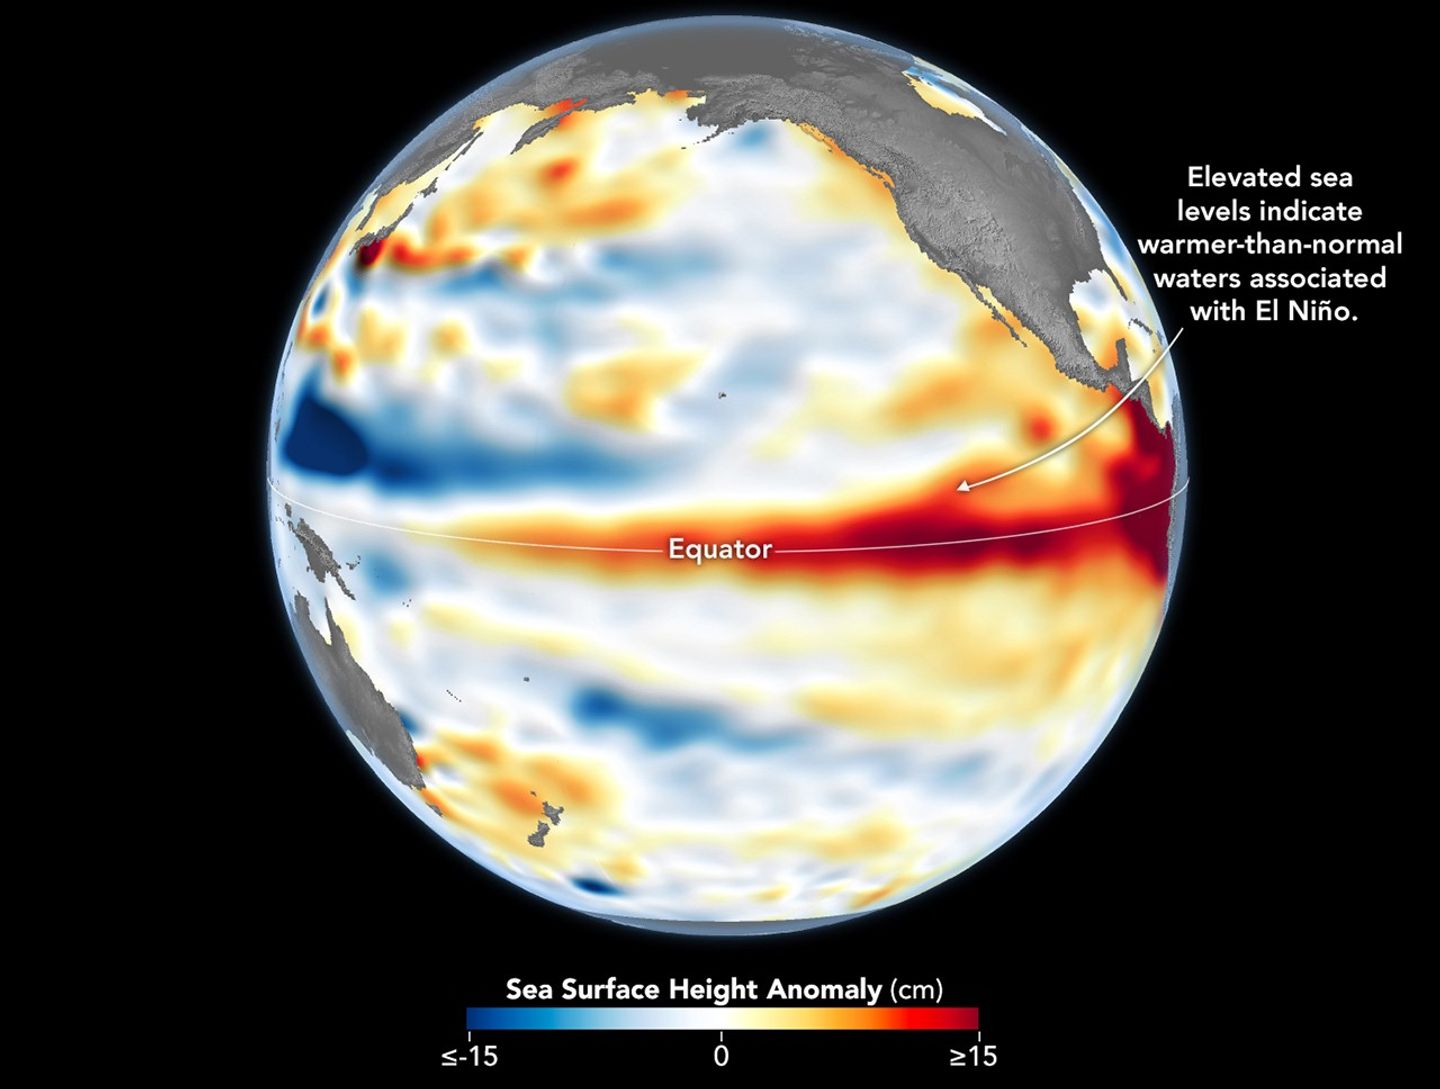
On June 8, 2026, a satellite passing over the Pacific Ocean measured sea surface heights more than 15 centimeters above normal across a wide stretch of the equatorial Pacific.
That reading came three days before NOAA officially declared a new El Niño, but it told scientists something surface temperature data cannot: a large reservoir of heat had already accumulated beneath the ocean’s surface, and the 2026 event was still strengthening. The satellite that captured the measurement, Sentinel-6 Michael Freilich, has been tracking the buildup since early spring, when the first pulses of warm water began crossing the Pacific from west to east.
NOAA confirmed the El Niño on June 11, after sea surface temperatures in the central and eastern equatorial Pacific held at least 0.5 degrees Celsius above average for several consecutive months, meeting the standard threshold for a declaration. What the satellite data adds to that picture is a read on how deep and how substantial the warming actually runs, which turns out to be a more reliable guide to where the event is headed.
Why Sea Surface Height Matters More Than Temperature Alone
When ocean water warms, it expands physically and takes up more volume, which raises the sea surface. That relationship turns changes in ocean height into a direct measure of stored heat, not just the temperature of the water sitting at the top. A shallow warm surface layer might not do much. A large subsurface heat reservoir, on the other hand, is what drives the atmospheric changes El Niño is known for, shifting the jet stream, altering storm tracks, and producing rainfall extremes far from the Pacific.
Sentinel-6 Michael Freilich, launched in 2020 by NASA and led by ESA for the European Union’s Copernicus Programme, maps water height across the entire ocean every 10 days with precision down to fractions of an inch.
According to NASA’s Jet Propulsion Laboratory, one of the satellite’s core roles is monitoring ocean features called Kelvin waves, which are the main mechanism by which heat moves from the western Pacific to the east in the months before an El Niño takes hold. The satellite’s data go beyond what fixed buoys or surface sensors can capture, providing a continuous, wide-angle picture of how the ocean’s heat is shifting across entire ocean basins.
How Warm Kelvin Waves Cross the Pacific
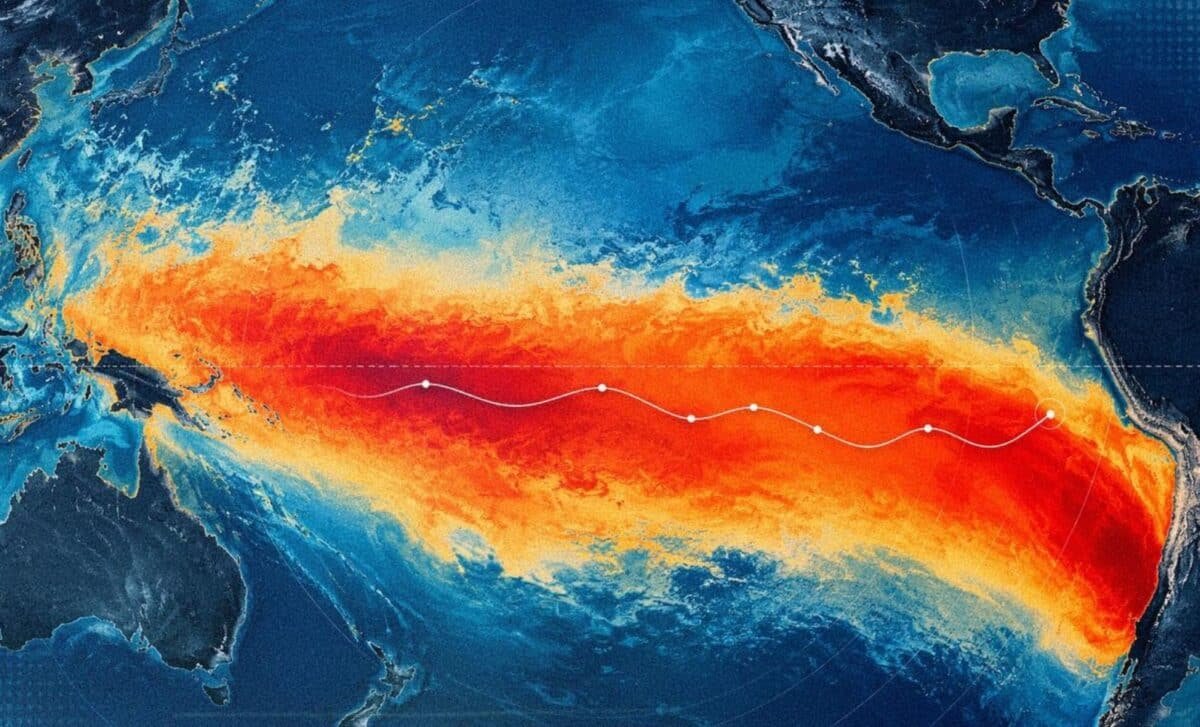
A Kelvin wave forms when trade winds in the far western equatorial Pacific weaken and briefly reverse direction. Normally, these winds blow from east to west. When they shift and blow the other way, even temporarily, warm water that had been banked in the western Pacific begins moving east.
As the wave travels across the ocean over several weeks, it deepens the warm surface layer, lowers the thermocline (the boundary between warm surface water and cold deeper water), and suppresses the upwelling of cold water that normally keeps the Pacific coasts of the Americas cooler. El Niño develops when several of these waves occur over a period of months and the accumulated warm water reaches the shores of Colombia, Ecuador, and Peru.
JPL data showed a small Kelvin wave forming near Micronesia in late January before fading by mid-February. A larger wave developed in early March and moved steadily eastward. By mid-May, sea levels near Peru had climbed more than 5.9 inches above long-term averages. More warm Kelvin waves were still approaching the eastern Pacific in early June, meaning the heat transfer was ongoing rather than complete.
“While this year’s event started a bit later than the big El Niños of 2015 and 1997, it’s beginning to catch up,” said Josh Willis, sea level researcher at JPL and project scientist for Sentinel-6 Michael Freilich. “We’ll see how big it gets.”
June 8 Data Shows Conditions Similar to 1997
The satellite image from June 8 drew particular attention from researchers because conditions in the western Pacific that day looked similar to the same period in 1997, the year one of the strongest El Niños on record emerged.
Severine Fournier, deputy project scientist for Sentinel-6 Michael Freilich and a sea level researcher at JPL, noted that warm conditions in the eastern Pacific have lagged somewhat behind the 1997 comparison, with fewer Kelvin waves having built up by the same calendar date. Even so, her assessment of the event’s likely trajectory shifted in the days leading up to the official NOAA declaration. “For now, it looks like it’s going to be a big one, more so than I would have said last week, but we still need more observations to know what’s going to happen,” she said in NASA’s Earth Observatory report.
The distinction between a moderate and a large El Niño carries concrete geographic consequences. Moderate events, like those that began in 2018 and 2023, produced drought and flooding mainly within and around the tropical Pacific. The 2015-2016 event reached much farther, contributing to drought across parts of Africa and heavy flooding in California.
El Niño events typically reach peak intensity between November and January, so several more months of ocean data will determine how far the 2026 event travels in that range. As Fournier put it in the JPL release, “Every El Niño is different. But they almost always make for a hot year and big changes in rainfall in parts of the globe.”
Sentinel-6 Michael Freilich currently serves as the official reference satellite for global sea level measurements, a record that traces back to the 1992 launch of TOPEX/Poseidon. Its successor, Sentinel-6B, launched in November 2025 and is expected to take over the mission by the end of 2026, ensuring the long-term ocean dataset continues without interruption.